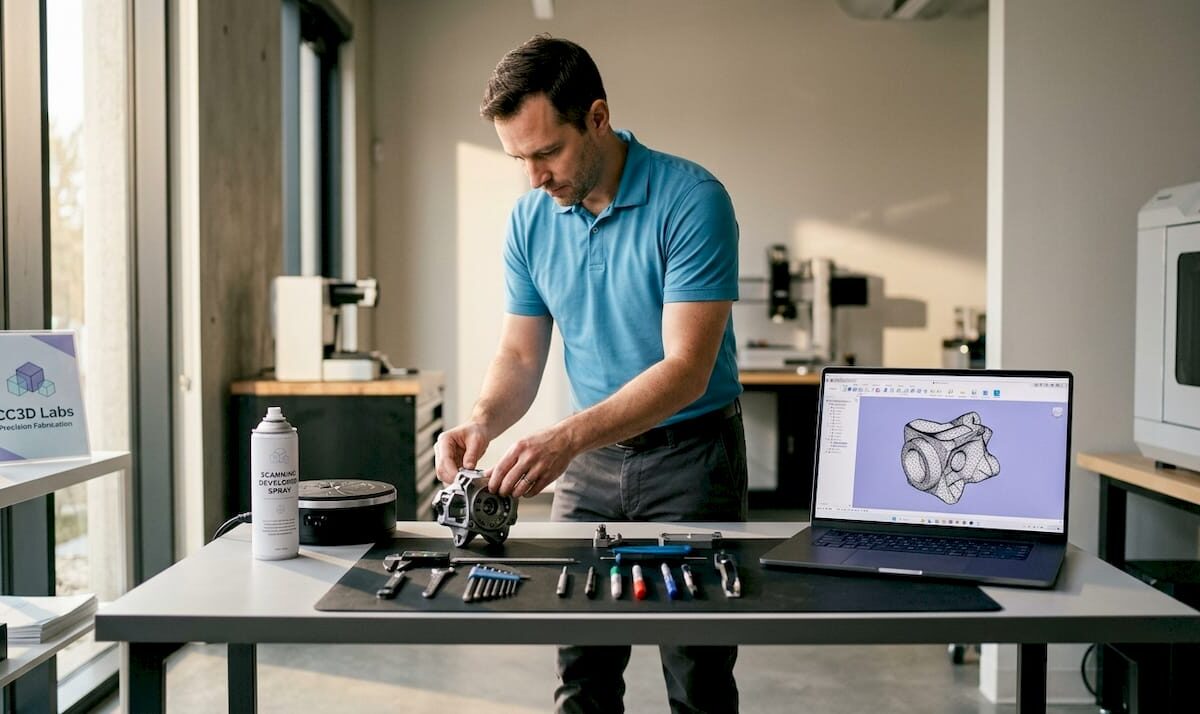
Technician preparing object for 3D scanning in workspace

How to Optimize 3D Scan Accuracy for Better Results


TL;DR:

  • Achieving precise and consistent 3D scan data requires thorough object preparation, appropriate scanner selection, and deliberate environmental control. Techniques like multi-angle scanning, slow overlapping passes, and real-time coverage checks significantly improve accuracy. Post-processing, including careful alignment, noise removal, and validation against references, is essential for producing reliable models.

Getting consistent, precise data from a 3D scanner is harder than the product demos make it look. Whether you’re capturing a machined part for reverse engineering, scanning an organic form for product development, or working up a prototype at home, knowing how to optimize 3D scan accuracy separates usable data from a frustrating rebuild. Incomplete geometry, surface noise, and misaligned point clouds are not hardware problems — they’re technique problems. This guide covers every phase from object prep through post-processing so you can get it right the first time.

Table of Contents

Key Takeaways

Point Details
Prepare surfaces before scanning Apply matte spray to reflective or dark objects to significantly improve point cloud quality.
Multi-angle scanning closes data gaps Scanning horizontally and vertically captures crevices and undercuts a single pass will miss.
Slow, overlapping movement is non-negotiable Erratic scanner movement causes tracking loss and leaves data holes that are hard to repair later.
Post-processing must be methodical Align, then clean noise, then fill holes in that order to avoid compounding errors in your mesh.
Verify accuracy against a reference Compare your scan output against physical measurements or a CAD model before committing to production.

How to optimize 3D scan accuracy before you start

Most accuracy problems are baked in before the scanner ever powers on. Preparation is where you make or break the final result, and it deserves more attention than most guides give it.

Surface treatment comes first. Objects with reflective, transparent, or very dark surfaces frequently require matte spray to improve scan fidelity. Structured light and photogrammetry-based scanners rely on reading surface texture and light patterns. A polished aluminum bracket or a black rubber gasket gives the sensor almost nothing to work with, producing sparse, noisy point clouds. A quick coat of removable scanning spray gives those surfaces the diffuse reflectivity they need.

Match your scanner to the object. A long-range LiDAR unit designed for architectural capture will not resolve the fine features of a 30mm mechanical component. Conversely, a close-range structured light scanner with a small field of view will lose tracking on a large enclosure. Before you scan, confirm your scanner’s rated accuracy, resolution, and working distance are appropriate for the object’s size and the level of detail you need to capture.
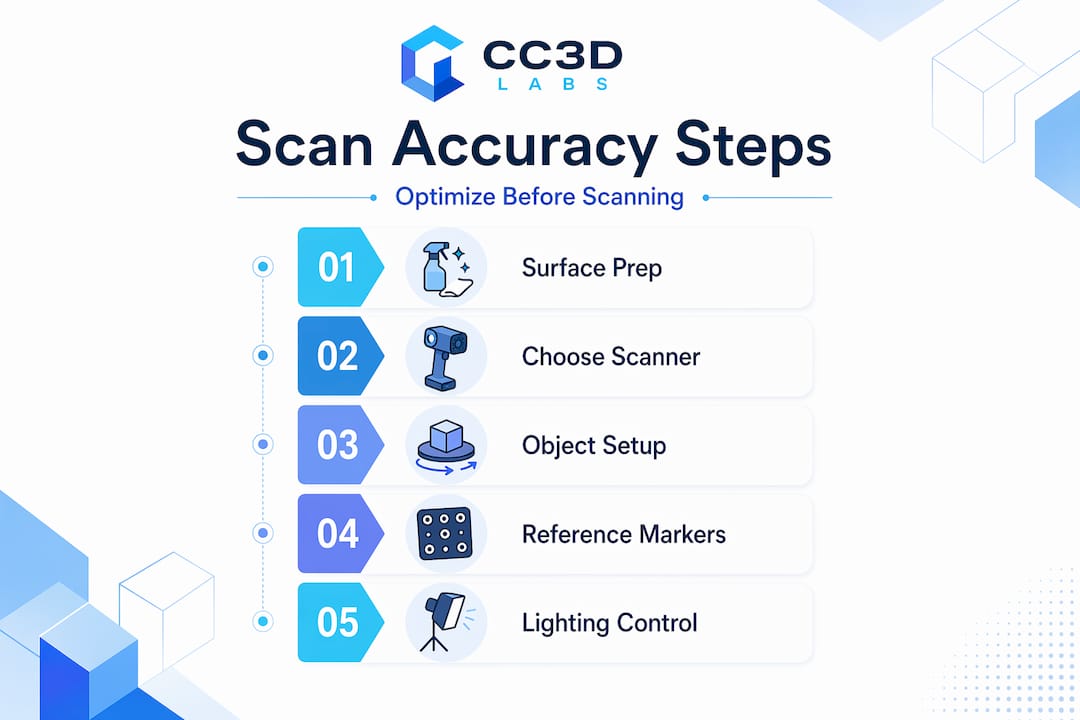
Infographic showing five steps to optimize 3D scan accuracy

Control your environment deliberately. Harsh shadows and direct sunlight cause errors and reduce model fidelity in ways that post-processing cannot fully recover. Set up in a space with soft, diffuse lighting. Overcast daylight works well outdoors. Indoors, use diffused studio lights or even translucent panels over standard fixtures. Avoid scanning near windows with strong directional sun.

Here’s a pre-scan checklist worth running through every time:

  • Clean the object of dust, grease, and fingerprints
  • Apply scanning spray to reflective, transparent, or very dark areas
  • Stabilize the object on a turntable or non-slip mat so it cannot shift mid-scan
  • Confirm ambient lighting is soft and consistent from all angles
  • Check that the scanner is fully warmed up and recently calibrated

Pro Tip: Place your object on a lazy Susan turntable with reference markers printed on the mat underneath. The scanner tracks the markers while you rotate the object, giving you automatic alignment across passes without any repositioning guesswork.

Step-by-step scanning techniques for better precision

With prep complete, what you do during the scan determines how much cleanup you create for yourself afterward. These techniques directly support improving 3D scanning precision.

  1. Move slowly and use overlapping passes. Slow, steady movement with overlapping passes prevents tracking loss and gaps in data. A general rule: each new pass should share at least 30% overlap with the previous one. Think of it like mowing a lawn rather than driving across a field.

  2. Alternate between horizontal and vertical scanner orientations. Rotating the scanner vertically reveals hidden crevices and undercuts that horizontal scanning misses entirely. This is one of the most underused techniques for capturing complex objects. Run a full horizontal pass, then tilt the scanner 90 degrees and make a dedicated vertical pass over any concave areas, threads, or slots.

  3. Apply markers to challenging or symmetrical surfaces. Markers improve scan stability and reduce tracking loss for objects with uniform color, repetitive geometry, or large featureless flat sections. Stick retro-reflective targets in irregular patterns across the object’s surface. The scanner uses these as fixed reference points when natural texture is insufficient.

  4. Adjust exposure and resolution settings for each object. A shiny metallic surface needs lower exposure than a matte plastic part to avoid overblown returns. Reduce resolution slightly on large, simple forms to keep file sizes manageable. Max out resolution only when fine surface detail genuinely matters for your downstream workflow.

  5. Scan from multiple orientations to ensure full coverage. Combining scans from different positions produces more complete coverage of hard-to-reach areas. For most freeform objects, plan for at least three to five distinct scan positions: top, front, back, and both sides at minimum.

  6. Monitor tracking feedback in real time. Most scanning software shows a live tracking indicator. If it starts to drop, stop and back up slightly rather than pushing forward. Recovering lost tracking mid-scan is almost always cleaner than trying to repair the resulting gap in post.

Pro Tip: For symmetrical objects like cylindrical parts or spherical housings, break the symmetry artificially by taping a small piece of masking tape in an irregular position. This gives the scanner a unique reference point to track across the full rotation.

Post-processing best practices for accurate models

Raw scan data is never the finished product. The post-processing phase is where you turn a rough point cloud into a dimensionally accurate mesh, and how you approach it matters as much as the scan itself.
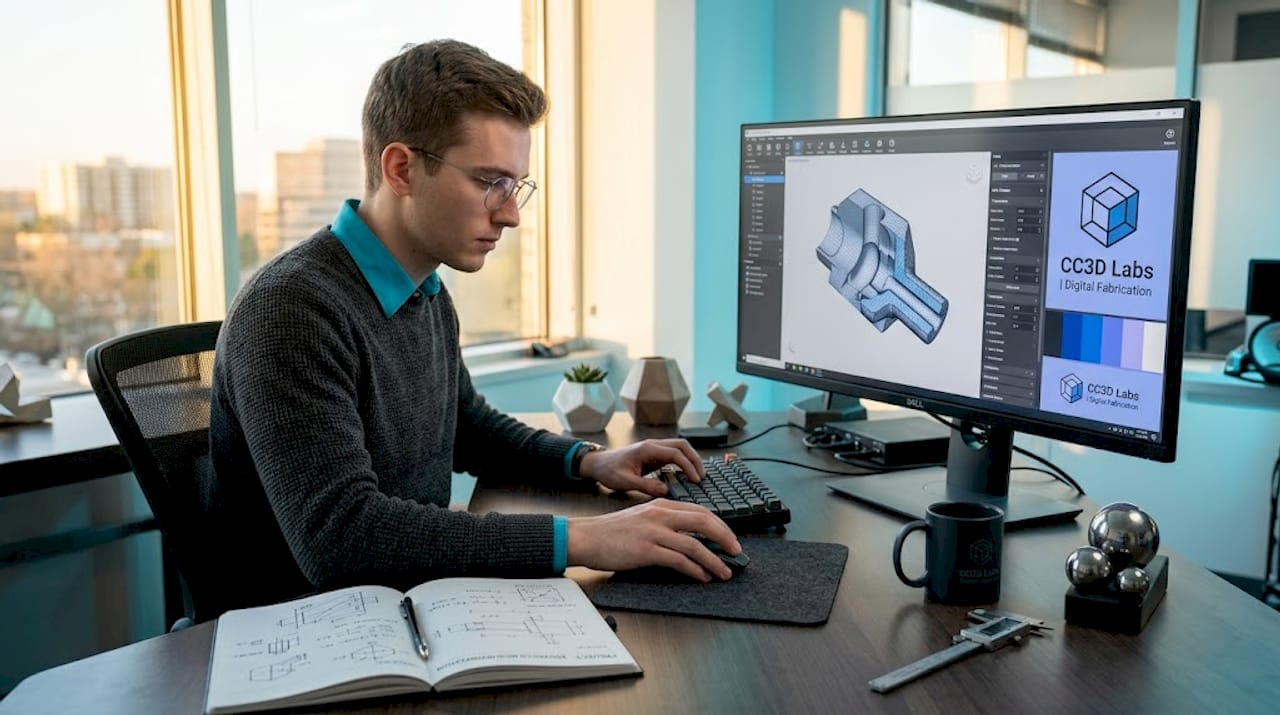
Engineer post-processing 3D scan model on computer

Align before you clean. When working with multiple scan passes, register and align all scans first before touching noise removal or mesh operations. Trying to merge passes after you’ve already modified one of them creates mismatches that can be nearly impossible to reconcile.

Post-processing steps like noise removal, mesh alignment, and hole filling are critical to preserving model accuracy. The order matters:

  • Alignment and registration. Use your software’s global registration function after doing a rough initial alignment. Software with advanced point cloud registration can significantly improve results, particularly when scans have limited overlap. Displacement-corrected geometric consistency algorithms are now making their way into commercial tools and dramatically improve reliability in low-overlap conditions.
  • Noise and outlier removal. Use statistical outlier filters with conservative settings. Aggressive noise removal destroys fine surface detail. Run the filter once at low strength, then visually inspect before applying again.
  • Hole filling and mesh repair. Fill small holes automatically, but handle large holes manually. Automated tools will often interpolate surface curvature incorrectly across wide gaps, creating geometry that was never actually scanned.
  • Export format selection. Export in formats appropriate to your workflow. OBJ and STL are standard for 3D printing and CAD import. PLY retains color and per-point metadata if you need it for inspection or archival. STEP or IGES are better for direct CAD environments when your software supports scan-to-CAD conversion.

Pro Tip: Before you export, run a quick visual inspection by cross-sectioning the mesh in your software. Slicing through the model at several planes reveals internal voids, duplicate geometry, and inverted normals that won’t be obvious from the outside.

Common mistakes that compromise scan accuracy

Even experienced operators repeat these errors. Knowing what to watch for saves you a full rescan.

  1. Ignoring environmental factors. Environmental vibrations, temperature swings, or air movement degrade scan quality by introducing noise and tracking errors. A large HVAC unit cycling on and off near your scan table is enough to introduce measurable error over a long scan session. Scan in a stable, quiet environment whenever precision is critical.

  2. Scanning too fast. Speed feels productive but erratic or rapid movements cause incomplete or misaligned scan passes. The scanner needs time to process and register each frame. Double the time you think you need for any object with complex geometry.

  3. Skipping regular calibration. Skipping calibration leads to inaccurate dimensions and misaligned scans, especially in engineering applications where tolerances are tight. Calibrate at the start of each session, after transport, and any time the scanner has been exposed to significant temperature change.

  4. Not checking coverage in real time. On-site quality checks during scanning reduce rework and improve model completeness. Discovering a missing area when you’re back at your desk means setting up the whole scan again. Spend 30 seconds reviewing coverage before you move the object.

“The single most expensive mistake in 3D scanning is assuming you got it. Verify before you move anything.” This is worth repeating every time you scan a critical part.

Verification methods that confirm scan accuracy

Producing a mesh is not the same as producing an accurate mesh. These techniques help you know which one you have.

Verification method What it checks When to use it
Physical measurement comparison Key dimensions against calipers or CMM data Before any manufacturing commitment
CAD overlay deviation map Color-coded deviation between scan and CAD Reverse engineering and inspection workflows
Point cloud overlap analysis Percentage of coverage and alignment error After merging multiple scan passes
Reference target residuals Error values from marker-based alignment Whenever markers are used during scanning

For high-stakes applications, compare your scan against a physical measurement reference at multiple checkpoints, not just the overall bounding dimensions. A scan can look dimensionally correct at the extremes while carrying localized errors in complex features. CAD overlay tools in software like Geomagic or Polyworks generate heat maps that visualize exactly where deviation is occurring and by how much.

Advanced algorithms like displacement-corrected geometric consistency significantly improve point cloud registration accuracy, particularly in low-overlap conditions. If your scanning software has registration quality scoring, pay attention to it. A high alignment error at the merge stage means your final model carries that error everywhere downstream.

Pro Tip: Scan a known reference object, such as a calibrated sphere or gauge block, at the start of each session. Measure it in software and compare to its certified dimensions. This gives you a real-world accuracy baseline for that specific scan session, not just the manufacturer’s spec sheet.

My honest take on mastering 3D scan accuracy

In my experience, the biggest gap between mediocre scans and exceptional ones is not hardware. I’ve watched engineers with top-tier scanners produce unusable data because they were in a hurry, and I’ve seen hobbyists with mid-range units capture engineering-grade geometry because they were patient and methodical.

Real-time verification changed how I work. I used to finish a full scan session and find missing coverage back at the workstation. Now I treat verification as part of the scanning workflow, not a step after it. That single habit cut my rescan rate dramatically.

The other thing I’ve learned: multi-angle scanning is not optional on anything with undercuts, threads, or deep pockets. A single-pass horizontal scan of a threaded housing looks complete until you try to use the mesh and realize all the thread geometry is missing. Adding a dedicated vertical pass takes five extra minutes and saves an hour of repair work.

The myth I push back on hardest is that a better scanner solves accuracy problems. It doesn’t. Technique, environment, and patience solve accuracy problems. The scanner is just the measurement tool. How you use it determines everything.

Get professional-grade 3D scanning and printing with Cc3dlabs
https://cc3dlabs.com

If you’re working on a project where accuracy genuinely matters, whether it’s a functional prototype, a reverse-engineered component, or a production part series, the DIY path has real limits. Cc3dlabs offers professional handheld 3D scanning (accuracy to ~0.1 mm) services alongside full-cycle 3D printing for engineers and product developers who need results they can trust. The team near Philadelphia handles everything from scan capture through final print, so your data quality is validated at every step. You can also explore the scanning accuracy checklist on the site to cross-reference your current workflow against professional standards. Get a free estimate online or reach out directly if you have a complex part that’s been giving you trouble.

FAQ

What causes poor accuracy in 3D scans?

Poor accuracy most often comes from environmental issues, surface conditions, and scanning technique rather than hardware. Reflective surfaces, harsh lighting, rapid scanner movement, and skipped calibration are the leading causes.

How many scan passes do I need for a complete model?

Most objects require at least three to five distinct scan orientations to achieve full coverage. Complex parts with undercuts, crevices, or internal features need more, and a dedicated vertical-orientation pass is often required.

Do I need scanning spray for every object?

Not every object needs it, but any surface that is highly reflective, transparent, or very dark should be treated. These surface types cause sparse or noisy point clouds that are difficult to repair in post-processing.

How often should I calibrate my 3D scanner?

Calibrate at the start of every scan session, after transporting the scanner, and after any significant temperature change. Skipping calibration introduces dimensional drift that accumulates across a session.

What file format should I export for engineering use?

OBJ and STL work well for most 3D printing applications. For CAD integration and inspection workflows, STEP or IGES formats preserve geometric data more reliably when your software supports scan-to-CAD conversion.
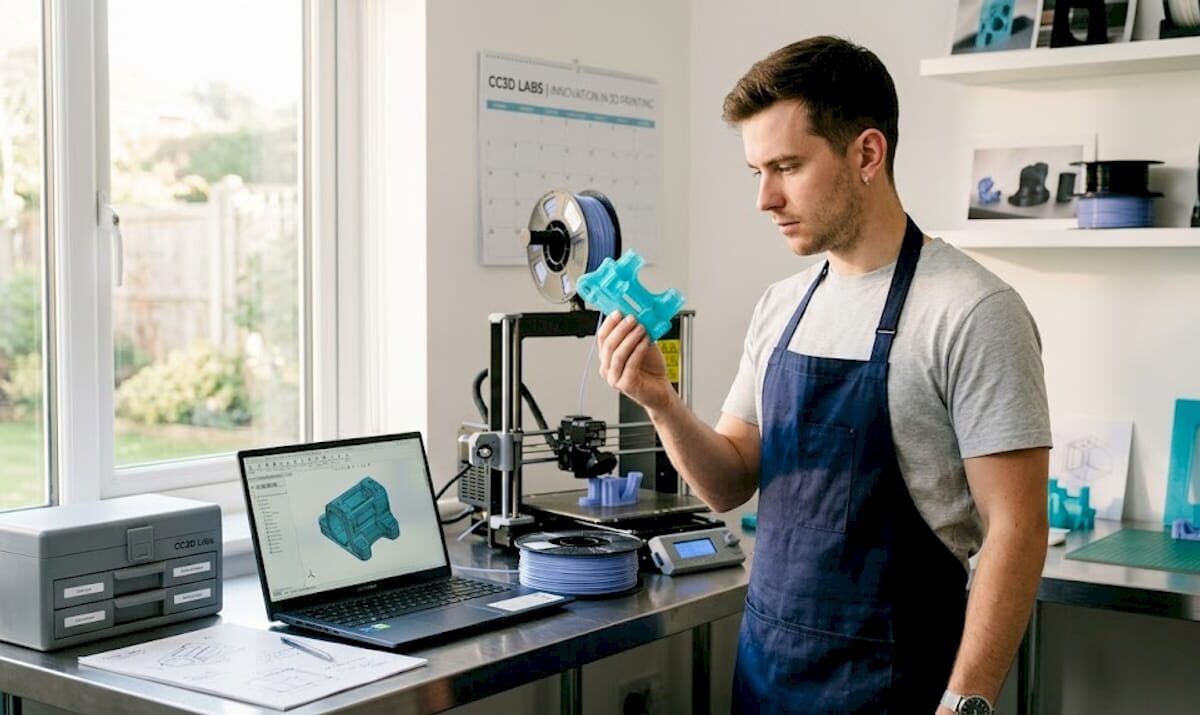
Engineer inspecting 3D printed part in home workspace

3D print infill explained: Strength, patterns, and efficiency


TL;DR:

  • Most engineers wrongly believe that filling 3D prints at 80% or 100% infill yields the strongest parts, but higher densities often lead to material waste without proportional strength gains. Structural integrity depends more on shell design and perimeter walls than infill density, with optimal performance usually achieved at 20-40% infill for most applications. Selecting appropriate patterns like gyroid and fine-tuning layer overlap and bonding are crucial for producing durable, cost-effective parts efficiently.

Most engineers assume that cranking infill density to 80% or 100% automatically produces the strongest possible 3D printed part. That’s one of the most persistent and costly misconceptions in additive manufacturing. The reality is more nuanced, and understanding it can save you material, time, and money while producing parts that actually perform better. This article covers what infill is, how density and pattern selection affect mechanical performance, and how to apply a practical workflow when printing functional prototypes or production components.

Table of Contents

Key Takeaways

Point Details
Infill basics Infill is the internal lattice structure that impacts strength, weight, material use, and print time.
Optimal density range Moderate densities (20–40%) typically deliver good strength-to-weight for prototypes and parts.
Wall thickness first Boosting perimeter walls often delivers more structural strength than increasing infill density alone.
Pattern selection matters Infill pattern choice affects mechanical properties and is based on part load requirements, not just aesthetics.
Iterative workflow Test and adjust infill settings, starting with pattern and shells, to optimize strength and efficiency for each project.

What is 3D print infill?

Before getting into optimization, you need a precise understanding of what infill actually does inside a part.

3D print infill is the internal lattice or pattern printed inside a part between the outer walls (perimeters) and any solid top and bottom layers. Think of it as the structural skeleton hidden beneath the surface of your printed part. Without infill, most parts would be hollow shells prone to crushing under any meaningful load. With too much infill, parts become unnecessarily heavy, expensive, and slow to print.

Infill density is expressed as a percentage. A 0% infill means the inside is completely hollow. A 100% infill means the interior is completely solid plastic. Every value in between represents a partial fill of that internal volume using a repeating geometric pattern. Understanding reliable 3D print design starts with recognizing how these interior decisions interact with surface and shell settings.

Here’s what infill density directly affects:

  • Strength: Higher density adds resistance to compression and internal deformation
  • Weight: More fill material increases part mass
  • Material consumption: Higher density uses more filament per part
  • Print time: Denser infill requires more passes, which extends print duration

The critical insight here, backed by data, is that the relationship between infill density and part strength is not linear. A part at 60% infill is not twice as strong as one at 30%. You hit diminishing returns quickly as you push past moderate densities, which is exactly why the myth of “more is better” leads engineers to over-engineer their prints unnecessarily.

Infill density Typical use case Trade-offs
5-15% Display models, lightweight housings Minimal strength, fast print
20-40% Functional prototypes, general use Good strength-to-weight balance
50-70% Mechanical parts, stress-bearing components Higher material cost, longer print
80-100% High-load or solid structural parts Maximum material, often unnecessary

Key takeaway: For most engineering applications, infill in the 20% to 40% range gives you the best trade-off between structural performance, weight, and cost. Going higher rarely produces proportional gains.

Infill density vs. strength: Finding the optimal balance

Now that you understand infill basics, let’s tackle how density affects strength, and when raising density is and isn’t the right move.

Here’s something that surprises many product developers: the outer walls of a 3D printed part do more work for structural strength than the infill itself. The infill’s mechanical role is primarily to support bridging and top surface layers, and to add internal resistance to crushing or compression. But overall tensile and flexural strength is dominated by the outer shell, which means that adding more perimeter walls often gives you far more structural benefit per minute of print time than bumping up infill density.

This changes how experienced engineers approach print settings. Instead of defaulting to high infill, they first ask: how many perimeter walls am I running?

A practical workflow for maximizing strength without unnecessary material use:

  1. Start with wall count. Increase perimeter count from 2 to 3 or 4 before touching infill. Each additional wall loop adds measurable tensile resistance.
  2. Set infill in the 20-40% range. Densities in this zone consistently deliver solid functional performance for most prototypes and parts.
  3. Check top and bottom layer count. Solid horizontal layers protect against surface deformation and contribute to overall stiffness.
  4. Review wall-to-infill overlap settings. Poor bonding between the infill lattice and the surrounding walls creates gaps and delamination risk. Infill bonding settings and perimeter overlap percentages can be more impactful than raw density numbers.
  5. Only increase infill density if testing reveals internal crush or core failure. If the failure mode shows wall cracking or layer separation, infill won’t fix it anyway.

This is also where low-volume manufacturing tips become especially relevant. When you’re producing small batches of functional components, every percentage point of unnecessary infill multiplies across your entire run, adding cost and time with no functional return.

Setting Impact on strength Impact on cost
Add 1 perimeter wall High Low
Increase infill 10% Moderate (diminishing) Moderate
Add 2 top/bottom layers Moderate Low
Increase infill 20% Low at higher densities High

Pro Tip: If a part fails during load testing, look at failure location first. Failure at the walls points to perimeter settings. Failure at layer seams points to bonding and print temperature. Only failures in the core of the part suggest infill density is the culprit, and even then, pattern selection may help more than raw density increases. This approach also helps you cut printing costs by eliminating unnecessary material.

Selecting the right infill pattern

Once you’ve targeted density, let’s explore how the underlying pattern changes both mechanical and tribological (friction and wear) properties.

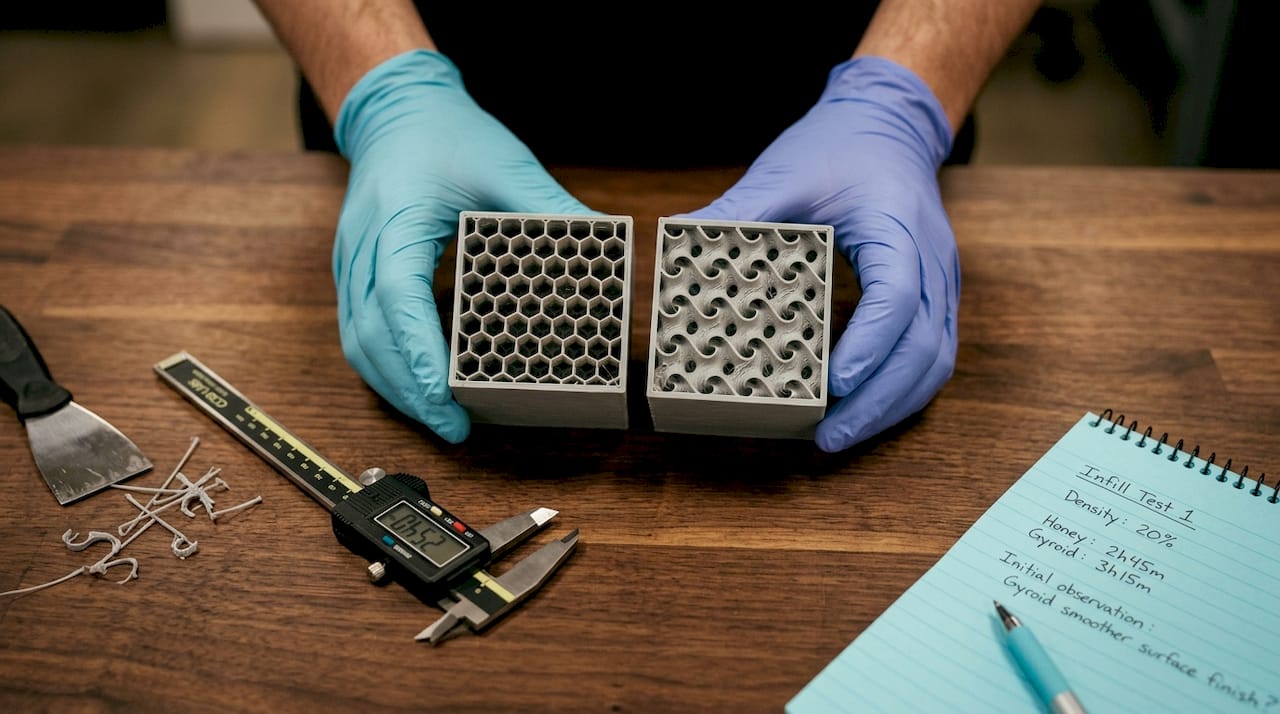
Hands displaying 3D print infill pattern samples

Infill pattern isn’t just a cosmetic setting. Common patterns like gyroid, grid, triangles, honeycomb, and cubic each have distinct mechanical characteristics based on how loads travel through their geometry. Choosing the wrong pattern for your application can leave performance on the table even at an appropriate density.

Here’s a breakdown of the most relevant patterns for engineering applications:

  • Gyroid: A continuous, three-dimensional curved surface that distributes load in multiple directions simultaneously. Near-isotropic, meaning it resists stress from any axis without a single weak direction. Best for parts under complex, unpredictable, or multi-directional loads.
  • Grid (rectilinear): Alternating lines in X and Y directions. Strong along both horizontal axes but weaker in diagonal shear. Fast to print and simple to tune.
  • Triangles: Triangulated geometry within each layer, distributing planar loads across three directions. More uniform in the XY plane than grid but still directional through the Z axis.
  • Honeycomb: Hexagonal cells inspired by natural structures. Excellent compressive strength perpendicular to the cell walls, making it ideal for parts that need to absorb crushing loads.
  • Cubic: Interlocking cubes that provide resistance in all three spatial axes. A practical choice when parts need to handle stress from multiple directions but gyroid would take too long to print.

The differences between these patterns aren’t just theoretical. Empirical testing published in peer-reviewed research shows that infill pattern and density together produce measurably different tensile strength, mass loss, and tribological performance outcomes. Pattern selection is a real engineering decision, not a stylistic one.

For an example of how complex geometries can be leveraged in manufacturing, consider how intricate structures like a complex infill pattern example demonstrate the range of internal geometry that’s possible with thoughtful design choices.

Pro Tip: Gyroid is the go-to pattern when you genuinely don’t know the exact loading direction of a part in service. It costs slightly more in print time than grid, but the near-isotropic performance eliminates a lot of guessing during printing challenge troubleshooting. For parts with clearly defined single-axis loads, triangles or grid often deliver equivalent performance at lower print time. Understanding your load direction is one of the highest-value inputs you can bring to creative applications for developers.

Practical infill selection: Workflow for prototypes and functional parts

With patterns and density understood, here’s how experienced engineers make practical infill decisions in the real manufacturing world.

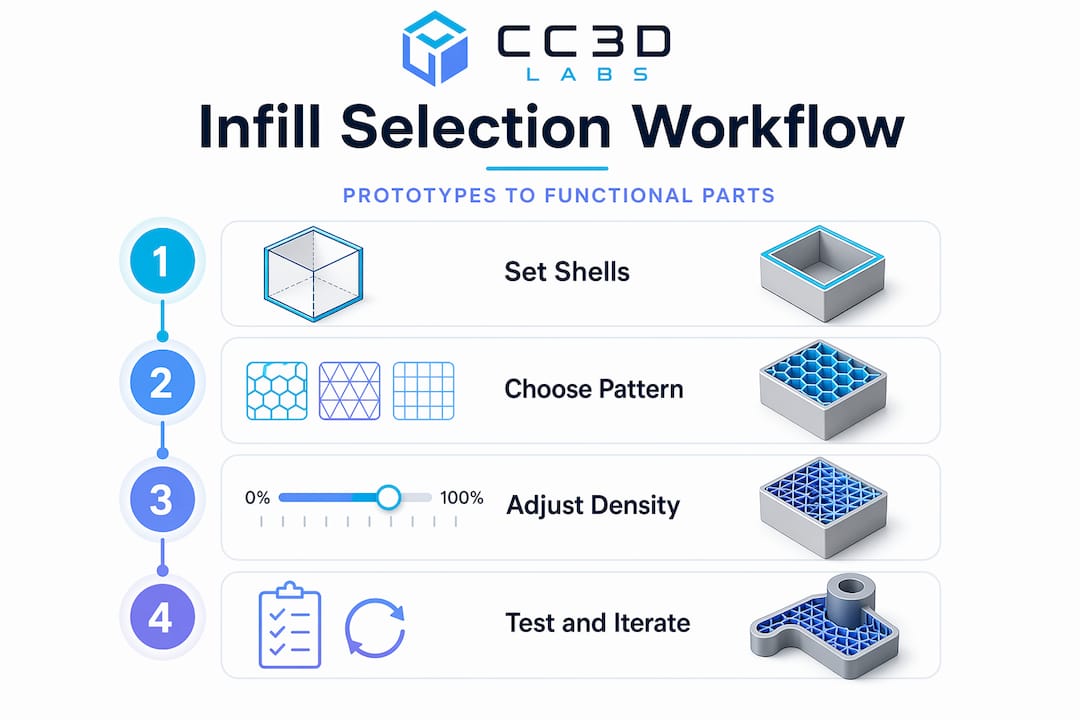
Infographic showing 3D print infill selection workflow

The biggest mistake product developers make is over-engineering print settings before they’ve tested a single prototype. Maxing out infill density on a first iteration wastes material, adds print time, and still doesn’t guarantee the part will survive its intended use. A structured, iterative approach produces better results faster.

Here is a repeatable workflow for selecting infill settings on functional parts and prototypes:

  1. Define the loading condition. Will the part experience compression, tension, torsion, or some combination? This determines which infill pattern makes sense before you touch any software settings.
  2. Choose the pattern first. Multi-directional or unknown loads: gyroid. Single-axis compression: honeycomb or cubic. Speed-critical batch parts with simple planar loads: grid or triangles.
  3. Set a moderate starting density. For functional parts, start with 20-30% infill and increase only if testing reveals core insufficiency. This range supports top layers effectively and handles most real-world loads without waste.
  4. Set wall count to at least 3 perimeters before printing the first test. Walls are your primary strength contributors and cost less per unit of strength than dense infill.
  5. Print and test mechanically. Apply load in the expected direction, either through a physical test rig or by reviewing deflection and failure mode by hand. Look at where the part fails.
  6. Diagnose before adjusting density. Wall failure: add perimeters. Layer separation: increase print temperature or slow down print speed. Surface deflection: add solid top and bottom layers. Core crush or internal buckling: increase infill density, then retest.
  7. Document your settings for each part type. Once a configuration passes functional testing, lock it in as a baseline for that application. This builds an internal library of proven settings over time.

You can find real-world applications of this approach in filament-based prototype examples that show how different structural decisions play out in practice.

Pro Tip: Use infill primarily for two jobs: supporting the top surface layers so they bridge cleanly without sagging, and providing enough core bulk to resist compression or crushing from assembly hardware like threaded inserts. If you’re using infill as the primary source of tensile or flexural strength, your wall count is probably too low.

Why optimal infill starts with smart shell design

After working through hundreds of functional part prints, the clearest pattern we’ve seen at CC 3D Labs is this: engineers who struggle with part failures almost always focus on infill density first. Engineers who produce consistently durable parts start with shell design.

The outer shell, the perimeter walls, the top and bottom solid layers, and the bonding between those shells and the infill lattice, that assembly is doing the majority of structural work in any filament-based print. Infill is the internal scaffold that holds the shell in shape and prevents collapse. Treating it as the primary strength mechanism leads to wasted material, longer print times, and parts that still fail because the underlying wall or bonding issue was never addressed.

We also see a specific failure mode that comes from insufficient wall-to-infill overlap. When the infill doesn’t bond fully to the perimeter walls, you get microscopic gaps at the junction. Under stress, those gaps become fracture initiation points. Adding more infill density doesn’t help because the structural discontinuity is at the interface, not in the core. Tuning overlap percentage and ensuring good layer adhesion through appropriate print temperature is a far more effective fix.

The other common pitfall is printing at 80% or 100% infill on every part “to be safe.” Beyond roughly 40-50% infill on most geometry types, you’re adding significant weight and print time for negligible mechanical return. This is particularly expensive when you’re running small batch production and those inefficiencies multiply across 20 or 50 parts. A well-designed production-grade guide approach means engineering the part once with the right settings, not compensating for design uncertainty with excess material.

The practical wisdom is simple: invest time in understanding your load conditions, set your shell correctly, pick the right pattern, start at moderate density, and test. That iterative approach will consistently outperform brute-force density in both performance and cost.

Enhance your prototypes with expert infill and 3D printing services

Knowing the theory is one step. Applying it to a real part under production constraints is another.

https://cc3dlabs.com

At CC 3D Labs, we work directly with engineers and product developers to translate these infill and shell design principles into reliable, tested parts. Whether you’re iterating on a prototype or moving toward batch runs, our team applies the same structured approach covered in this guide, starting with load conditions and working through pattern and density selection to deliver parts that perform. Explore our 3D printing services to see what’s possible, browse printable prototypes and parts for application ideas, or get deeper technical context in our filament prototyping guide. Free online estimates are available so you can see cost and feasibility before committing.

Frequently asked questions

Does infill density always increase part strength?

No. The strength-vs-density relationship is not linear and shows clear diminishing returns at higher densities. Wall thickness and wall-to-infill bonding typically have a greater impact on functional strength than raw density increases.

What’s the most common infill pattern used for prototypes?

Gyroid is widely used for prototypes because it provides near-isotropic strength, meaning it resists stress uniformly in multiple directions rather than favoring a single load axis, making it a reliable default when loading conditions aren’t fully defined.

How do I choose infill settings for a functional part?

Select a pattern matched to your expected load direction, then start with moderate densities in the 20-40% range. Test mechanically, identify the actual failure mode, and adjust only the setting that addresses it rather than defaulting to higher infill.

What happens if infill doesn’t bond well to the walls?

Weak wall-to-infill bonding produces gaps and delamination risk at the wall junction, which creates fracture initiation points under load. Proper overlap percentage and print temperature settings are essential for maintaining structural continuity between infill and perimeter walls.

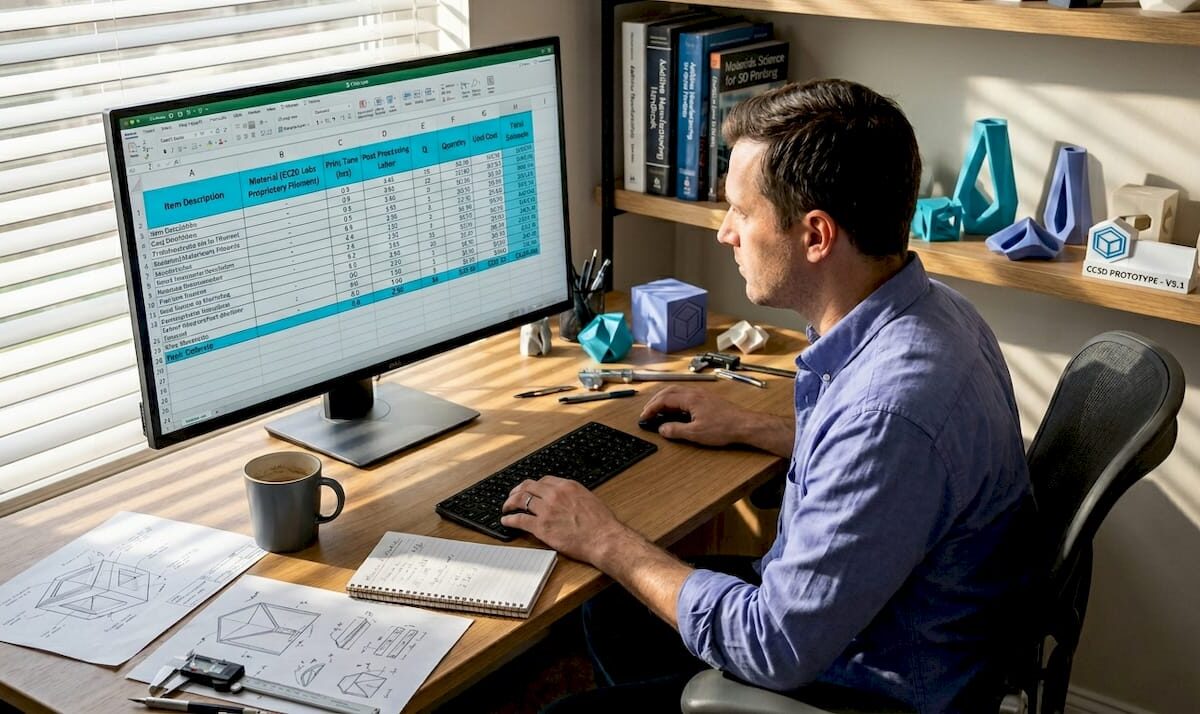
Product developer analyzing 3D printing costs

Cut 3D Printing Costs: Proven Strategies for Product Developers


TL;DR:

  • Managing 3D printing expenses involves considering labor, machine time, design complexity, and overhead, which often outweigh raw material costs.
  • Optimizing design and workflow, choosing suitable materials, and evaluating alternative manufacturing methods are crucial steps to ensure cost-effective production.

Managing 3D printing expenses is rarely as simple as buying cheaper filament or running machines faster. The real cost picture includes labor, machine time, design complexity, post-processing, and purchase overhead, and businesses that focus only on one variable often end up paying more overall. Whether you’re producing custom prototypes or scaling toward batch manufacturing, understanding how costs actually stack up, and where to apply targeted reductions, can dramatically change your bottom line. This article lays out research-backed methods to help product developers and manufacturing businesses reduce 3D printing expenses without compromising part quality.

Table of Contents

Key Takeaways

Point Details
Major cost drivers Material, labor, and purchase costs are the biggest factors in 3D printing expenses.
Design optimization impact Smart design choices can cut up to 54% of print time and 16% of material use.
Workflow efficiencies matter Batching and efficient post-processing help lower per-part costs significantly.
Material and process fit Matching the right material and printing process to your project prevents overspending.
Alternative solutions Sometimes, traditional manufacturing is cheaper—make cost-based decisions, not just tech-based ones.

Understand the real cost drivers in 3D printing

Most businesses assume material is the biggest cost in 3D printing. That assumption is frequently wrong, and it leads to poor decisions. A thorough cost breakdown reveals that labor, machine time, design complexity, and purchase overhead often outweigh raw material expense, particularly in custom or low-volume scenarios.

Here’s a breakdown of the main cost factors you need to track:

  • Material cost: Filament, resin, or powder consumed during printing, including support material that gets discarded
  • Machine time: The hours a printer runs to complete a job, which directly ties to energy consumption and capacity allocation
  • Labor: Time spent on setup, monitoring, support removal, finishing, and quality checks
  • Purchase cost: Amortized cost of equipment, software licenses, and facility overhead
  • Design complexity: More complex geometries require longer print times, more support, and more labor to finish

A clinical study evaluating 3D-printed orthoses against traditionally manufactured ones found that labor and purchase cost dominated the 3D printing expense structure. Labor alone accounted for 62.2% of total cost, while purchase cost contributed 22.2%. By comparison, conventional thermoplastic orthoses relied mainly on material (69.4%) and labor (30.6%).

Cost factor 3D-printed orthosis Conventional orthosis
Labor 62.2% 30.6%
Purchase cost 22.2% N/A (minimal overhead)
Material Smaller share 69.4%
Mean total cost €46.54 €30.28

In some product categories, 3D printing is not automatically cheaper. Labor and overhead can push total cost well above what conventional manufacturing would charge. Accurate cost analysis always has to account for all six factors, not just material weight.

For your planning, you can get accurate 3D printing cost estimations upfront before committing to a production run. Knowing your full cost structure is the first step toward finding where to cut.

Optimize your design for cost-effective printing

Knowing what affects your costs, the next step is learning how your design decisions directly alter material, labor, and time expenses. Design is where the biggest leverage lives, and most businesses underuse it.

Engineer optimizing 3D printing design

Multi-objective optimization means adjusting your model to minimize two or more cost factors at the same time, rather than just solving for one. For example, reducing overhangs reduces support material, but doing that alone may increase print height and extend print time. A multi-objective approach balances both simultaneously.

Published research shows that multi-objective design optimization reduced material use by 11 to 16% and print time by 12 to 54% compared to sequential single-variable optimization. That kind of improvement does not require a major redesign. It requires the right design review process.

Practical design changes that reduce cost:

  • Reduce part height: Taller prints take longer, layer by layer. Reorienting a part, when the geometry allows, can dramatically cut print time.
  • Minimize overhang angles: Overhangs beyond 45 degrees typically require support. Each gram of support material adds both material cost and removal labor.
  • Hollow non-structural sections: Infill is one of the most adjustable cost levers. Reducing infill density where strength is not critical directly cuts material and time.
  • Simplify surface features: Fine decorative details increase print time without adding structural value for functional parts.
  • Split and reassemble complex geometries: Sometimes printing a part in two simpler pieces, then joining them, is cheaper than printing a complex monolithic form.

Pro Tip: Before sending any file to print, run a quick design checklist that flags overhangs, wall thickness violations, and unnecessary height. Many of the biggest cost savings happen at this stage, before a single layer is laid down. For a deeper look at designing reliable prints, CC 3D Labs has practical guidance specific to functional prototypes and production parts.

The right material choice also matters here. Some designs that look complex in one material become simpler and cheaper in another. Explore choosing cost-efficient materials to understand how material selection interacts with your design geometry.

Choose the right materials and process for your application

While design is crucial, your choice of material and print process can make or break your savings. Let’s compare how different options shift the cost equation depending on whether you’re making prototypes or end-use parts.

The core principle here is that the cheapest prototyping process is rarely the cheapest production process. PLA is inexpensive and prints quickly, making it ideal for concept models. But for functional end-use parts, it may fail under load or temperature, leading to reprints and wasted cost. Choosing a stronger material upfront, even if it costs a bit more per kilogram, can reduce total cost over a product’s lifecycle.

As research confirms, objective importance varies by AM method, meaning that what you optimize for, whether material, time, or support volume, should change depending on which print technology you’re using. FDM, SLA, and SLS all have different dominant cost drivers.

Here’s a practical comparison:

Technology Typical material Best use case Primary cost driver
FDM (filament) PLA, PETG, ABS, ASA Prototypes, functional parts, jigs Machine time, labor
SLA (resin) Photopolymer resin High-detail prototypes, patterns Material cost, post-processing
SLS (powder) Nylon, TPU Complex geometry, batch production Machine and powder cost
Metal AM Stainless, titanium Aerospace, medical, high-stress parts Material and machine cost

How to evaluate your material and process combination step by step:

  1. Define the functional requirement: What stress, temperature, and environment will this part face?
  2. Identify the minimum viable material: Choose the least expensive material that meets that requirement, not the most capable one.
  3. Calculate total cost, not just material cost: Include setup, print time, post-processing, and failure rate.
  4. Compare against alternatives: A simple injection-molded or machined part may cost less at volume, even if 3D printing is cheaper per prototype.
  5. Check batch economics: Some processes become cost-competitive only above certain volumes. SLS, for example, benefits significantly from packing multiple parts into a single build.

For businesses scaling from prototyping toward higher volumes, reviewing a production-grade printing guide will clarify when to switch processes and how to manage the transition economically. If you’re still evaluating what project type fits your production needs, matching print jobs to needs can help you narrow it down faster.

Streamline your workflow to reduce hidden costs

After selecting your ideal material and process, it’s time to address workflow tweaks that further slash hidden or secondary costs. These are the expenses businesses rarely track, yet they compound quickly.

Labor, as the data shows, is the largest cost factor in many 3D printing scenarios, making up 62.2% of total cost in real production environments. That means any workflow step that consumes labor, without adding direct value to the finished part, is a cost reduction opportunity.

Key workflow strategies to implement:

  • Batch similar parts together: Combining multiple small jobs into a single build plate reduces setup time and maximizes machine utilization. Each setup avoided is labor saved.
  • Standardize post-processing steps: When post-processing follows a consistent sequence, workers complete it faster and make fewer errors. Random or ad hoc finishing inflates labor time.
  • Track failure rates by design and material: If certain part configurations fail print quality checks regularly, the rework cost is invisible but real. Logging failures helps you identify and fix root causes.
  • Reduce unnecessary support structures at the workflow level: Even after design optimization, slicing software settings can further minimize support. Spending a few extra minutes in the slicer often saves more time in post-processing.
  • Consolidate orders: Sending multiple small orders separately is almost always more expensive per part than consolidating them into planned batch runs.

Pro Tip: Use digital job tracking tools, even a simple shared spreadsheet, to log setup times, failure rates, and post-processing hours per job type. Within a few weeks, patterns emerge that reveal where your actual time and money are going. For specific low-volume manufacturing tips tailored to 3D printing, CC 3D Labs offers practical guidance from real production experience.

Staying current on process innovation also matters. Reviewing latest cost-saving trends in 3D printing manufacturing for 2026 can reveal new materials, software tools, or workflow approaches that further cut costs without requiring major investment.

Know when 3D printing isn’t the cheapest solution

Even the best cost-cutting strategies have limits. Sometimes, the wisest move is to opt out of 3D printing entirely for a given part. Recognizing this scenario early prevents you from sinking optimization effort into a process that was never the right fit.

The orthosis research is a clear example. Even after accounting for reduced material waste in 3D printing, the mean cost per 3D-printed part was €46.54 versus €30.28 for the conventionally manufactured version. The labor and purchase overhead of 3D printing erased any material savings.

Warning signs that 3D printing may not be your cheapest option:

  • High labor for finishing: If your parts require extensive sanding, painting, assembly, or inspection after printing, labor costs escalate fast
  • Large production volumes: At high quantities, injection molding or die casting often delivers a lower per-part cost
  • Simple, flat, or extrudable geometry: Parts that can be cut, stamped, or machined from stock material are usually cheaper to produce conventionally
  • Tight dimensional tolerances: When post-machining is required to hit tolerance, the combined cost of printing plus machining often exceeds just machining from the start
  • Heavy parts: Dense, heavy parts require significant material and print time, reducing the cost advantage of 3D printing versus alternatives

Always compare your 3D printing cost estimate with at least one alternative manufacturing method before committing. Sometimes conventional or hybrid manufacturing delivers greater savings, especially when labor and post-processing are factored in correctly.

Understanding your 3D printing alternatives is not a concession to failure. It’s smart cost strategy. The goal is always the right process for the job, not loyalty to any single technology.

Our take: Cost cutting isn’t about one magic fix

After walking through all of these methods, here’s the perspective that often gets left out of cost reduction conversations. Businesses frequently chase the single biggest lever, whether that’s cheaper filament, a faster printer, or a new slicer setting, expecting it to solve their cost problem. It rarely does.

Real cost reduction in 3D printing is additive. It comes from stacking several small wins: a better-designed part, an appropriate material, batched workflow, and honest process selection. Each individual change may save 5 to 15% in isolation. But combined, they often cut total production cost by 30 to 50% without sacrificing part quality.

The uncomfortable truth is that the most expensive mistake is not choosing the wrong material. It’s running an unoptimized process repeatedly and measuring only the material cost. Labor is the hidden giant in most manufacturing environments, and 3D printing is no exception.

We’ve also seen businesses resist switching away from 3D printing for a specific part because they’ve invested in the workflow. That’s a sunk cost bias. When a conventional process is genuinely cheaper, making the switch is not a setback. It’s what good cost management looks like.

Tracking manufacturing trends insight helps you stay current as the economics of different technologies shift year over year. The right answer today may look different in 18 months as new materials and processes enter the market.

The most effective cost strategy we see at CC 3D Labs is a simple one: analyze all cost drivers, optimize design first, choose the minimum viable material and process, batch the workflow, and then honestly evaluate whether 3D printing is the right call for each job. That sequence, applied consistently, delivers better savings than any single optimization ever could.

Take the next step with expert 3D printing support

Implementing these strategies on your own takes time, and miscalculations can cost more than the savings you’re chasing. Working with a specialist who understands the full cost picture from design through finishing makes the entire process faster and more predictable.

https://cc3dlabs.com

CC 3D Labs works with product developers and manufacturing businesses across the Philadelphia region and beyond, helping them reduce costs through smarter design, material selection, and production planning. Our professional 3D printing services cover everything from early-stage prototyping to batch production runs, with transparent pricing and fast turnaround. If you’re not sure where to start, explore 3D printing options to see what’s possible, then reach out for a free estimate tailored to your specific project and volume.

Frequently asked questions

What is the most effective way to cut 3D printing costs?

Optimizing your design with a multi-objective approach is one of the highest-impact changes you can make, with material and time savings of up to 16% and 54% respectively. Layering that with workflow batching and honest process selection multiplies the impact further.

Are labor and purchase costs more important than materials in 3D printing?

In many real-world production scenarios, yes. Studies show labor accounts for 62.2% of total 3D printing cost, making it the dominant expense, not material.

When is 3D printing not the cheapest solution?

When parts require heavy finishing, have simple geometry, or are produced in high volumes, conventional manufacturing often wins on cost. Research confirms 3D printing can cost more than alternatives even when material waste is reduced, once labor and overhead are counted.

Does batch size affect 3D printing costs?

Yes. Larger batches reduce the per-part burden of setup, machine initialization, and labor, making the unit cost fall significantly as batch size increases.

Can support volume and overhang area impact cost?

Absolutely. Support structures add material cost and, more importantly, removal labor. Design changes that eliminate or minimize support, as shown by multi-objective optimization research, directly reduce both cost categories at once.

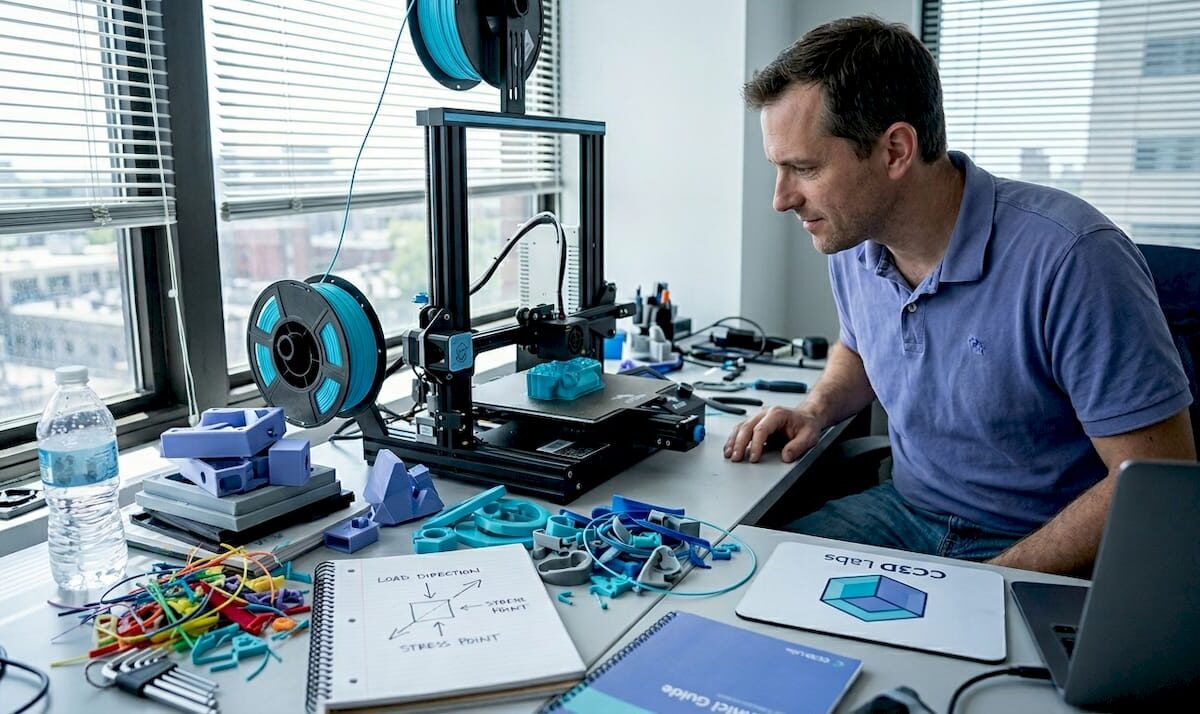
Product developer monitoring desktop 3D printer

Overcome common 3D printing challenges: pro tips for product developers


TL;DR:

  • Many common FDM print failures, such as warping, poor bed adhesion, and anisotropy, arise from thermal and structural issues. Addressing enclosure temperature, bed surface prep, and layer orientation can significantly improve mechanical strength and dimensional stability. Mastering systematic failure analysis with optimized parameters and environment controls distinguishes top engineers from novices.

You pull a prototype off the build plate, measure it against spec, and it’s warped 2mm at the corner. The layer interface cracked under a basic load test. Your material cost is sunk, your timeline is slipping, and the root cause isn’t obvious at first glance. These aren’t rare flukes — they’re predictable failure modes with known solutions. This article walks you through the most persistent mechanical, material, and dimensional challenges in FDM 3D printing, with data-backed strategies and practical settings adjustments you can act on today.

Table of Contents

Key Takeaways

Point Details
Tackle warping and adhesion Control thermal gradients and use enclosures to promote strong first layer and prevent warping.
Optimize infill for strength Select infill and layer parameters based on material and mechanical performance targets.
Minimize dimensional drift Account for thermal cycling and orientation to maintain tight tolerances.
Embrace expert tuning Advanced troubleshooting and layering techniques resolve stubborn quality issues for production parts.
Professional help speeds results When issues persist, specialist 3D printing services can accelerate troubleshooting and delivery.

Mechanical issues: warping, bed adhesion, and anisotropy

Most print failures trace back to three interconnected problems: warping, poor bed adhesion, and structural weakness from anisotropy. Understanding why each happens is the first step toward eliminating them from your workflow.

Warping and poor bed adhesion are among the most common mechanical challenges in FDM printing, caused by thermal shrinkage and uneven cooling, particularly with ABS and Nylon. When the bottom layers cool faster than the layers above them, differential contraction bends corners upward. This is especially destructive for flat, wide parts where the geometry amplifies every degree of temperature change.

For engineers building functional prototypes, the fix involves more than just spreading glue stick on the print bed. Here are the main factors to address:

  • Enclosure temperature control: Keep ambient air around 40 to 50°C for ABS; this slows the cooling rate and reduces stress buildup between layers.
  • Bed surface and prep: Use PEI sheets, glass with adhesive, or specialized surfaces matched to your material. Clean with IPA before every run.
  • First layer calibration: A first layer squished 10 to 15% below nominal layer height maximizes contact area and adhesion force.
  • Brim and raft usage: Wide brims (at least 8mm) physically resist corner lift. Rafts add thermal mass at the base and help equalize temperature.

“For materials prone to warping like ABS and Nylon, enclosing the build volume and tightly calibrating the first layer settings are non-negotiable steps before advanced parameter tuning.” — Recommendations from FDM troubleshooting best practices.

Anisotropy is the other silent killer. Because FDM prints layer by layer, the bond between layers is always the weakest link in the structure. Flexural strength drops 40%+ at a 90° raster angle compared to 0°, with PLA reaching optimal performance at 0° orientation and 50% infill (167 MPa flexural in one published study — typical PLA flexural values run 80–110 MPa), and ABS peaking at 0° orientation with 75% infill (126 MPa). If your part will see bending loads, the layer stacking direction relative to load direction is not a detail — it’s a design decision.

When working on manufacturing-grade 3D printing projects, these baseline mechanical principles need to be locked in before you start optimizing higher-level parameters.

Pro Tip: Before printing any structural prototype, sketch out the primary load direction on paper and orient the model so critical surfaces are parallel to the raster lines. This one decision can roughly double effective flexural strength without changing a single slicer setting.

For anyone newer to these concepts, the filament 3D printing prototyping guide provides a solid foundation before tackling advanced troubleshooting.

Strength and material parameter selection: the infill and raster effect

Once you understand the mechanical failure sources, the next problem is knowing exactly which parameters to adjust for your specific material and application. Infill and raster angle are not just cosmetic settings — they are structural design variables.

Infill density contributes up to 80% of the variation in tensile, compressive, and impact strength, while layer thickness has the biggest influence on hardness and surface roughness. The practical implication: if you need a load-bearing part, infill is your primary lever. If you need a smooth surface for a fit-check prototype, layer thickness takes priority.

Here’s a step-by-step approach to selecting infill and raster angle for common engineering materials:

  1. Identify the primary load type (tensile, compressive, bending, impact). Each responds differently to infill patterns and density.
  2. Select material based on operating environment. ABS for moderate heat and chemical exposure, PLA for room-temperature prototypes, Nylon for dynamic or fatigue-heavy applications.
  3. Set raster angle to 0° as the starting default for maximum strength in the load direction. Reserve 45° or alternating rasters for isotropic requirements.
  4. Set infill starting point based on the table below, then adjust after a destructive test sample.
  5. Print a small coupon first. Test before committing material and time to the full part.
Material Optimal raster angle Infill % Flexural strength Notes
PLA 50% 167 MPa (study value) Best for room-temp structural prototypes
ABS 75% 126 MPa (study value) Needs enclosure; warping risk above 100mm
Nylon 0° to 45° 60 to 75% Varies Moisture absorption affects results; dry filament before printing
PETG 45° alternating 50 to 60% ~120 MPa Good layer adhesion; less anisotropy than ABS

The optimal mechanical parameters for each material matter, but they only deliver results when the print environment (enclosure, bed temp, ambient humidity) supports them. Engineers who treat slicer settings as isolated variables without controlling the full print environment consistently get inconsistent results.

Pro Tip: Run a 3-sample destructive test at your target infill and raster settings before committing to a full production run. A simple bend or pull test on small coupons catches 80% of strength-related surprises before they cost you time and material on full-sized parts.

Engineer examines broken 3D printed samples

For a deeper look at how geometry choices interact with these parameters, the resource on designing reliable 3D prints is worth reviewing before finalizing your CAD for print.

Dimensional accuracy and stability under thermal cycling

Strength and adhesion matter at print time, but many engineering parts face an equally serious challenge after they leave the printer: dimensional instability under repeated temperature changes. This is critical for any part used in automotive testing, outdoor hardware, or environments with significant temperature swings.

Dimensional drift under thermal cycling is well-documented: parts can show a height increase of +0.3 mm after just 10 cycles between -20°C and 80°C, with the Z-direction the most affected due to anisotropy between layers. For parts with tight tolerances on height, stacking, or assembly clearance, that 0.3 mm can mean the difference between a fit and a failure.

The Z-direction is vulnerable for a structural reason: the bond between layers is weaker than the base polymer itself. When thermal expansion and contraction work on that interface repeatedly, the cumulative dimensional shift is greater than what you’d see in an injection-molded part made from the same base material.

Here’s a practical checklist to minimize thermal drift in dimensionally critical parts:

  • Pre-condition parts before measuring. Let them stabilize at room temperature for at least 2 hours after printing before taking dimensional readings.
  • Orient tall features horizontally where tolerance matters. A feature that runs in the XY plane is more dimensionally stable than one that grows in Z.
  • Use an enclosure during printing to slow cooling uniformity and reduce residual stress that contributes to post-print drift.
  • Anneal parts after printing. For PLA, annealing at 80 to 100°C for 30 to 60 minutes (above PLA’s ~60°C glass transition — below that, annealing does little) stress-relieves the polymer and improves dimensional stability under subsequent thermal loads.
  • Specify material with appropriate thermal coefficient. PETG and ABS both outperform PLA at elevated temperatures; check the glass transition temperature against your expected operating range.

If you’re not familiar with terms like anisotropy, glass transition temperature, or layer adhesion mechanics, the 3D printing terminology resource breaks these down clearly for product developers.

The industry is also moving toward tighter process controls for thermal stability, which you can explore in manufacturing trends in 3D printing to understand where the best practices are headed in 2026.

Expert troubleshooting: fine-tuning, layering, and advanced material tips

With the fundamentals addressed, the final layer of mastery involves diagnosing persistent quality issues that survive basic parameter optimization. These are the problems that show up in advanced prototypes and pre-production runs, and they require a more systematic approach.

The following troubleshooting moves address common high-level flaws:

  • Stringing and oozing: Increase retraction distance by 0.5mm increments and reduce travel speed. Dry filament thoroughly before printing, especially with hygroscopic materials like Nylon and PETG.
  • Under-extrusion: Check for partial clogs, recalibrate the extruder e-steps, and verify that flow rate matches actual filament diameter at the tip.
  • Layer separation: Increase layer temperature in 5°C increments and reduce print speed on perimeter passes. Check that part cooling fans aren’t overwhelming inter-layer bonding on materials like ABS.
  • Surface inconsistency on top layers: Increase top layer count from 3 to 5, and verify that infill percentage is high enough to support bridging at the top.

Retraction and flow calibration directly affect part quality in ways that don’t show up in standard strength testing but can catastrophically affect functional performance and appearance. Setting 0° raster and 50 to 75% infill for maximum structural performance is part of this optimization loop.

Advanced layering strategies deserve particular attention for fatigue applications. Multiplane layering, where the model is split and printed in sections oriented on different axes, can meaningfully mitigate Z-direction weakness. It adds complexity, but for parts that will see cyclic loading, it’s a legitimate engineering intervention rather than a workaround.

“Notches and stress concentrations in printed parts reduce fatigue life dramatically. A sharp root radius of just 0.3 mm can reduce epoxy fatigue life by two-thirds, and the same principle applies to layer transitions and internal geometry in FDM parts.”

This is an often-overlooked design point. Engineers frequently focus on infill percentage and raster angle while ignoring sharp internal corners or abrupt geometry transitions that act as stress concentrators during cyclic loading. Rounding internal radii to at least 0.5mm and smoothing layer transition geometry can have more impact than an extra 10% of infill.

For a full walkthrough of how to implement these strategies from print setup through post-processing, the step-by-step guide for quality prints provides actionable detail on each stage.

Comparison summary: challenges, impacts, and solutions at a glance

Use this table as a reference checklist when diagnosing a failed print or planning a new high-stakes prototype.

Challenge Symptom Root cause Affected property Proven fix
Warping Lifted corners, base distortion Uneven cooling, thermal shrinkage Dimensional accuracy, adhesion Enclosure, heated bed, brim, first layer calibration
Anisotropy Weak Z-axis fractures Layer bonding weaker than bulk Flexural and tensile strength 0° raster, orientation control, multiplane layering
Poor bed adhesion Part detaches mid-print Dirty bed, wrong surface, low temp Print completion, dimensional base IPA clean, PEI sheet, bed temp match to material
Dimensional drift Tolerance failure after use Thermal cycling, Z-anisotropy Assembly fit, tolerance stack-up Pre-conditioning, annealing, horizontal feature orientation
Strength loss Fracture under expected load Low infill, wrong raster, wrong material Load-bearing capacity Optimize infill, raster angle, run coupon tests

Each row in this table maps to a root cause you can test and a fix you can implement immediately. The most common mistake is treating these as unrelated problems when they often compound: warping creates residual stress that worsens anisotropy-driven failure under load.

Beyond the basics: why mastering failure modes separates top engineers

Here’s an uncomfortable observation from working with product developers at all levels: the engineers who produce the most reliable printed parts aren’t necessarily using better machines or more exotic materials. They’re the ones who document failures systematically and treat every failed print as diagnostic data.

Textbooks cover the ideal behavior of materials. They rarely cover what happens when ABS prints on a Tuesday in summer at 72% humidity and the first layer adhesion degrades compared to a dry February run. The real world is messy, and default slicer profiles are designed for average conditions, not for your specific geometry, ambient environment, or load requirements.

The engineers who outperform their peers share a common habit: they don’t accept “it just failed” as a root cause. They ask which direction it failed, at what layer, under what load, after how many cycles. That diagnostic precision is what allows rapid iteration instead of repeated guessing.

Chasing new printer releases or exotic filaments without mastering failure analysis is a trap. A well-dialed FDM printer with calibrated settings for manufacturing-grade print quality will consistently outperform a newer machine running on default profiles. Process mastery compounds. Hardware upgrades plateau.

The engineers who build durable, accurate prototypes are the ones who embrace the analytical layer underneath the print settings. That’s not a personality type. It’s a skill you build deliberately, starting with the frameworks in this article.

Professional support and rapid solutions for 3D printing challenges

Persistent print failures can eat weeks of development time when you’re working without access to experienced process feedback. Sometimes the fastest path forward isn’t tuning another setting — it’s getting a professional set of eyes on your geometry, material selection, and print strategy.

https://cc3dlabs.com

At CC 3D Labs, we work directly with product developers and engineers facing exactly the challenges covered in this article. Whether you need rapid turnaround on a tight-tolerance prototype, expert guidance on material and parameter selection, or reliable batch production with verified dimensional accuracy, our team near Philadelphia is set up to deliver. Explore our full 3D printing services, or start with the guide to rapid prototyping to understand how a professional workflow compresses your iteration cycle. For filament-based projects specifically, prototyping with filament printing outlines exactly how we approach each stage from design review to final part delivery.

Frequently asked questions

What causes prints to warp during 3D printing?

Warping is caused by uneven cooling and thermal shrinkage in the base layers, especially with ABS and Nylon. Using an enclosure, a heated bed, and a wide brim effectively reduces warping across most material types.

How does infill density affect part strength in 3D printing?

Infill density contributes up to 80% of the variation in tensile, compressive, and impact strength in FDM printed parts. Higher infill significantly increases load-bearing capacity while layer thickness primarily affects surface hardness and finish.

Why are parts weaker in the Z-direction in FDM 3D printing?

The 40%+ drop in flexural strength at 90° raster angle compared to 0° is a direct result of inter-layer bonding being weaker than the bulk polymer. Orienting the part so critical load paths run in the XY plane is the most effective structural mitigation.

What is the impact of thermal cycling on dimensional accuracy?

Thermal cycling induces measurable dimensional drift, with parts showing up to +0.3 mm height change after 10 cycles between -20°C and 80°C. The Z-direction is most vulnerable due to the anisotropic nature of layer bonding in FDM parts.

How can I improve bed adhesion for better 3D print results?

Clean the print bed with IPA before each run, use a surface matched to your material like PEI for ABS or glass for PLA, and calibrate your first layer height to slightly over-extrude for maximum contact area. Adding an enclosure to stabilize ambient temperature eliminates the thermal differential that causes early delamination.